 Rep The Set
The app found what I could not feel
A session that felt good the whole way through. A personal best at the end. But the numbers found something I could not feel. One question was enough to find it.
I set a personal best last week.
Five stations, three rounds: 15 sandbag lunges, 400 m row, 20 wall balls, 400 m SkiErg, 10 burpees, all the way through three times.
Thirty-four minutes fifty.
Nothing hurt, nothing felt off, and I would happily have told you it was one of my better sessions.
Then I opened the app, and there it was.
Something I had not felt at all.
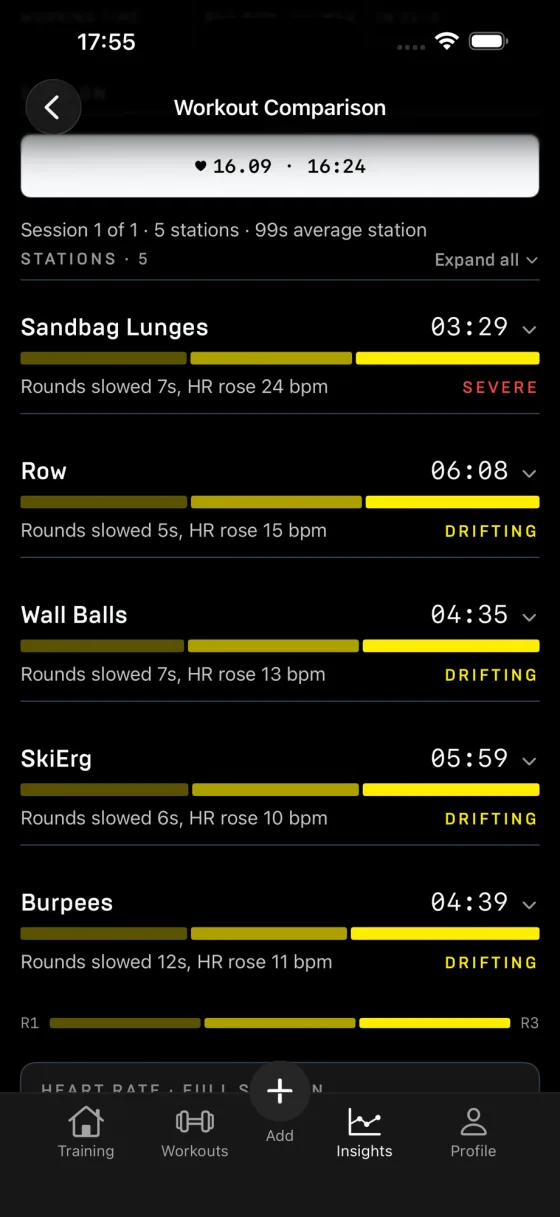
Rep The Set ran the timer, called the stations and recorded every round while I worked.
I wear a chest strap, so it had my heart rate too.
Intensity 3.2 out of 5.
Load 6,714.
Density 71%.
I spent 24:50 actually working inside the 34:50 session, with an average heart rate of 146 and a peak of 161.
Thirty-nine percent of the session was in Zones 4 and 5.
Then it broke all of that down station by station.
If those names mean nothing to you yet, Reading your session analytics: decoupling, drift and load goes through every one of them, one card at a time.
The timer, the builder and the race simulation are all free. Rep The Set on the App Store.
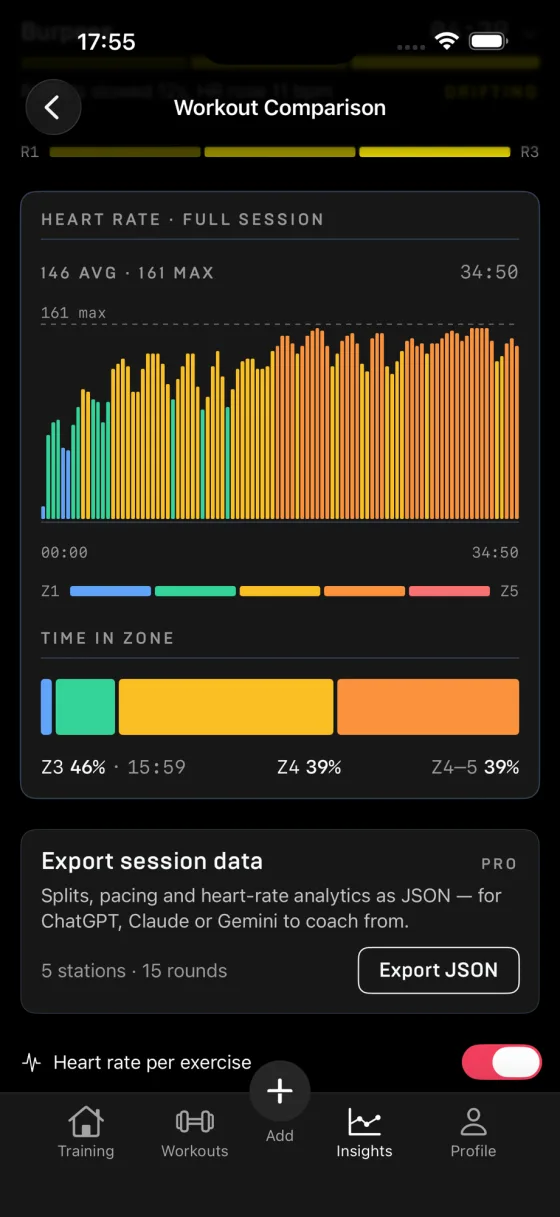
So I exported it.
One tap, and the session was a file.
I dropped it into an AI and asked one thing:
Which station is holding me back?
This is what it was reading.
Every station, every round, with the heart rate I ran it at.
| Station | Round 1 | Round 2 | Round 3 |
|---|---|---|---|
| Sandbag lunges, 15 reps | 1:08 · 111 bpm | 1:06 · 138 bpm | 1:15 · 152 bpm |
| Row, 400 m | 2:00 · 127 bpm | 2:03 · 143 bpm | 2:05 · 150 bpm |
| Wall balls, 20 reps | 1:28 · 138 bpm | 1:32 · 151 bpm | 1:35 · 155 bpm |
| SkiErg, 400 m | 1:58 · 144 bpm | 1:57 · 156 bpm | 2:04 · 158 bpm |
| Burpees, 10 reps | 1:31 · 140 bpm | 1:25 · 152 bpm | 1:43 · 152 bpm |
It came straight back with the lunges.
Only seven seconds separate my first and last rounds, which sounds like almost nothing.
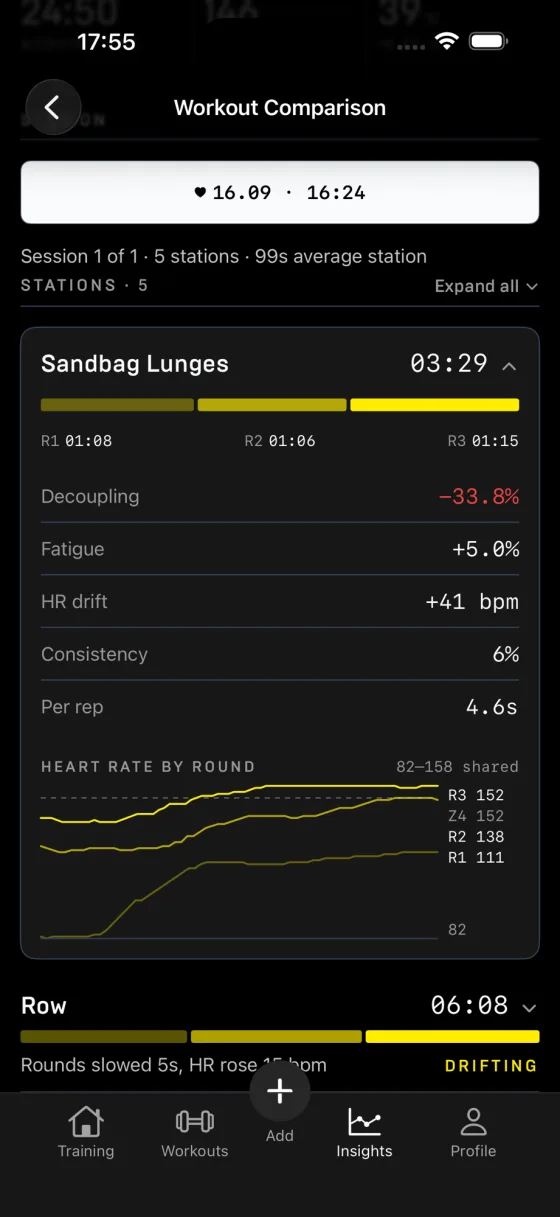
Now look at the heart rate: 111, then 138, then 152.
Same fifteen reps.
Forty-one more beats a minute to produce them.
That relationship has a name: decoupling.
Rep The Set calculated -33.8% for the lunges, by far the largest value of the five stations.
More on what that number is measuring: Reading your session analytics: decoupling, drift and load.
My engine was fine.
My legs were not.
The burpees settled it.
Round 2 was my fastest of the day at 1:25.
Round 3 took 1:43, twenty-one percent slower, and my heart rate was 152 for both of them.
Same heart rate, slower body.
The heart rate stayed at 152 while the station got 21% slower.
There is one thing the numbers cannot see on their own.
I take 45 seconds between stations and 60 seconds between rounds.
The lunges are the first station, so I hit them fresh, then get only a minute before they come around again.
Heavy leg work does not magically recover in sixty seconds.
I would have bet on my cardiovascular fitness being the limit.
I would have lost.
The word for what I was missing is strength endurance: my legs were giving out before my engine did.
And the answer isn’t simply to push harder next time.
I can change the station order, increase the rest between rounds, reduce the lunge load, or redesign the session so the weakness gets trained instead of repeatedly exposed.
Here is what got me.
I told the AI nothing about myself.
No age, no weight, no training history.
It wasn’t trying to assess me as an athlete.
It was looking at the relationship between my pace and heart rate, station by station.
The data was enough to spot the pattern.
One tap.
One sentence.
And I had been training this way for months with that answer sitting in my pocket, without ever thinking to ask.
The data was already there.
I just hadn’t asked the right question.
Go and look at your own: Rep The Set on the App Store. Export is a Pro feature, alongside full analytics and band targets.
What else Pro unlocks: what Pro adds.